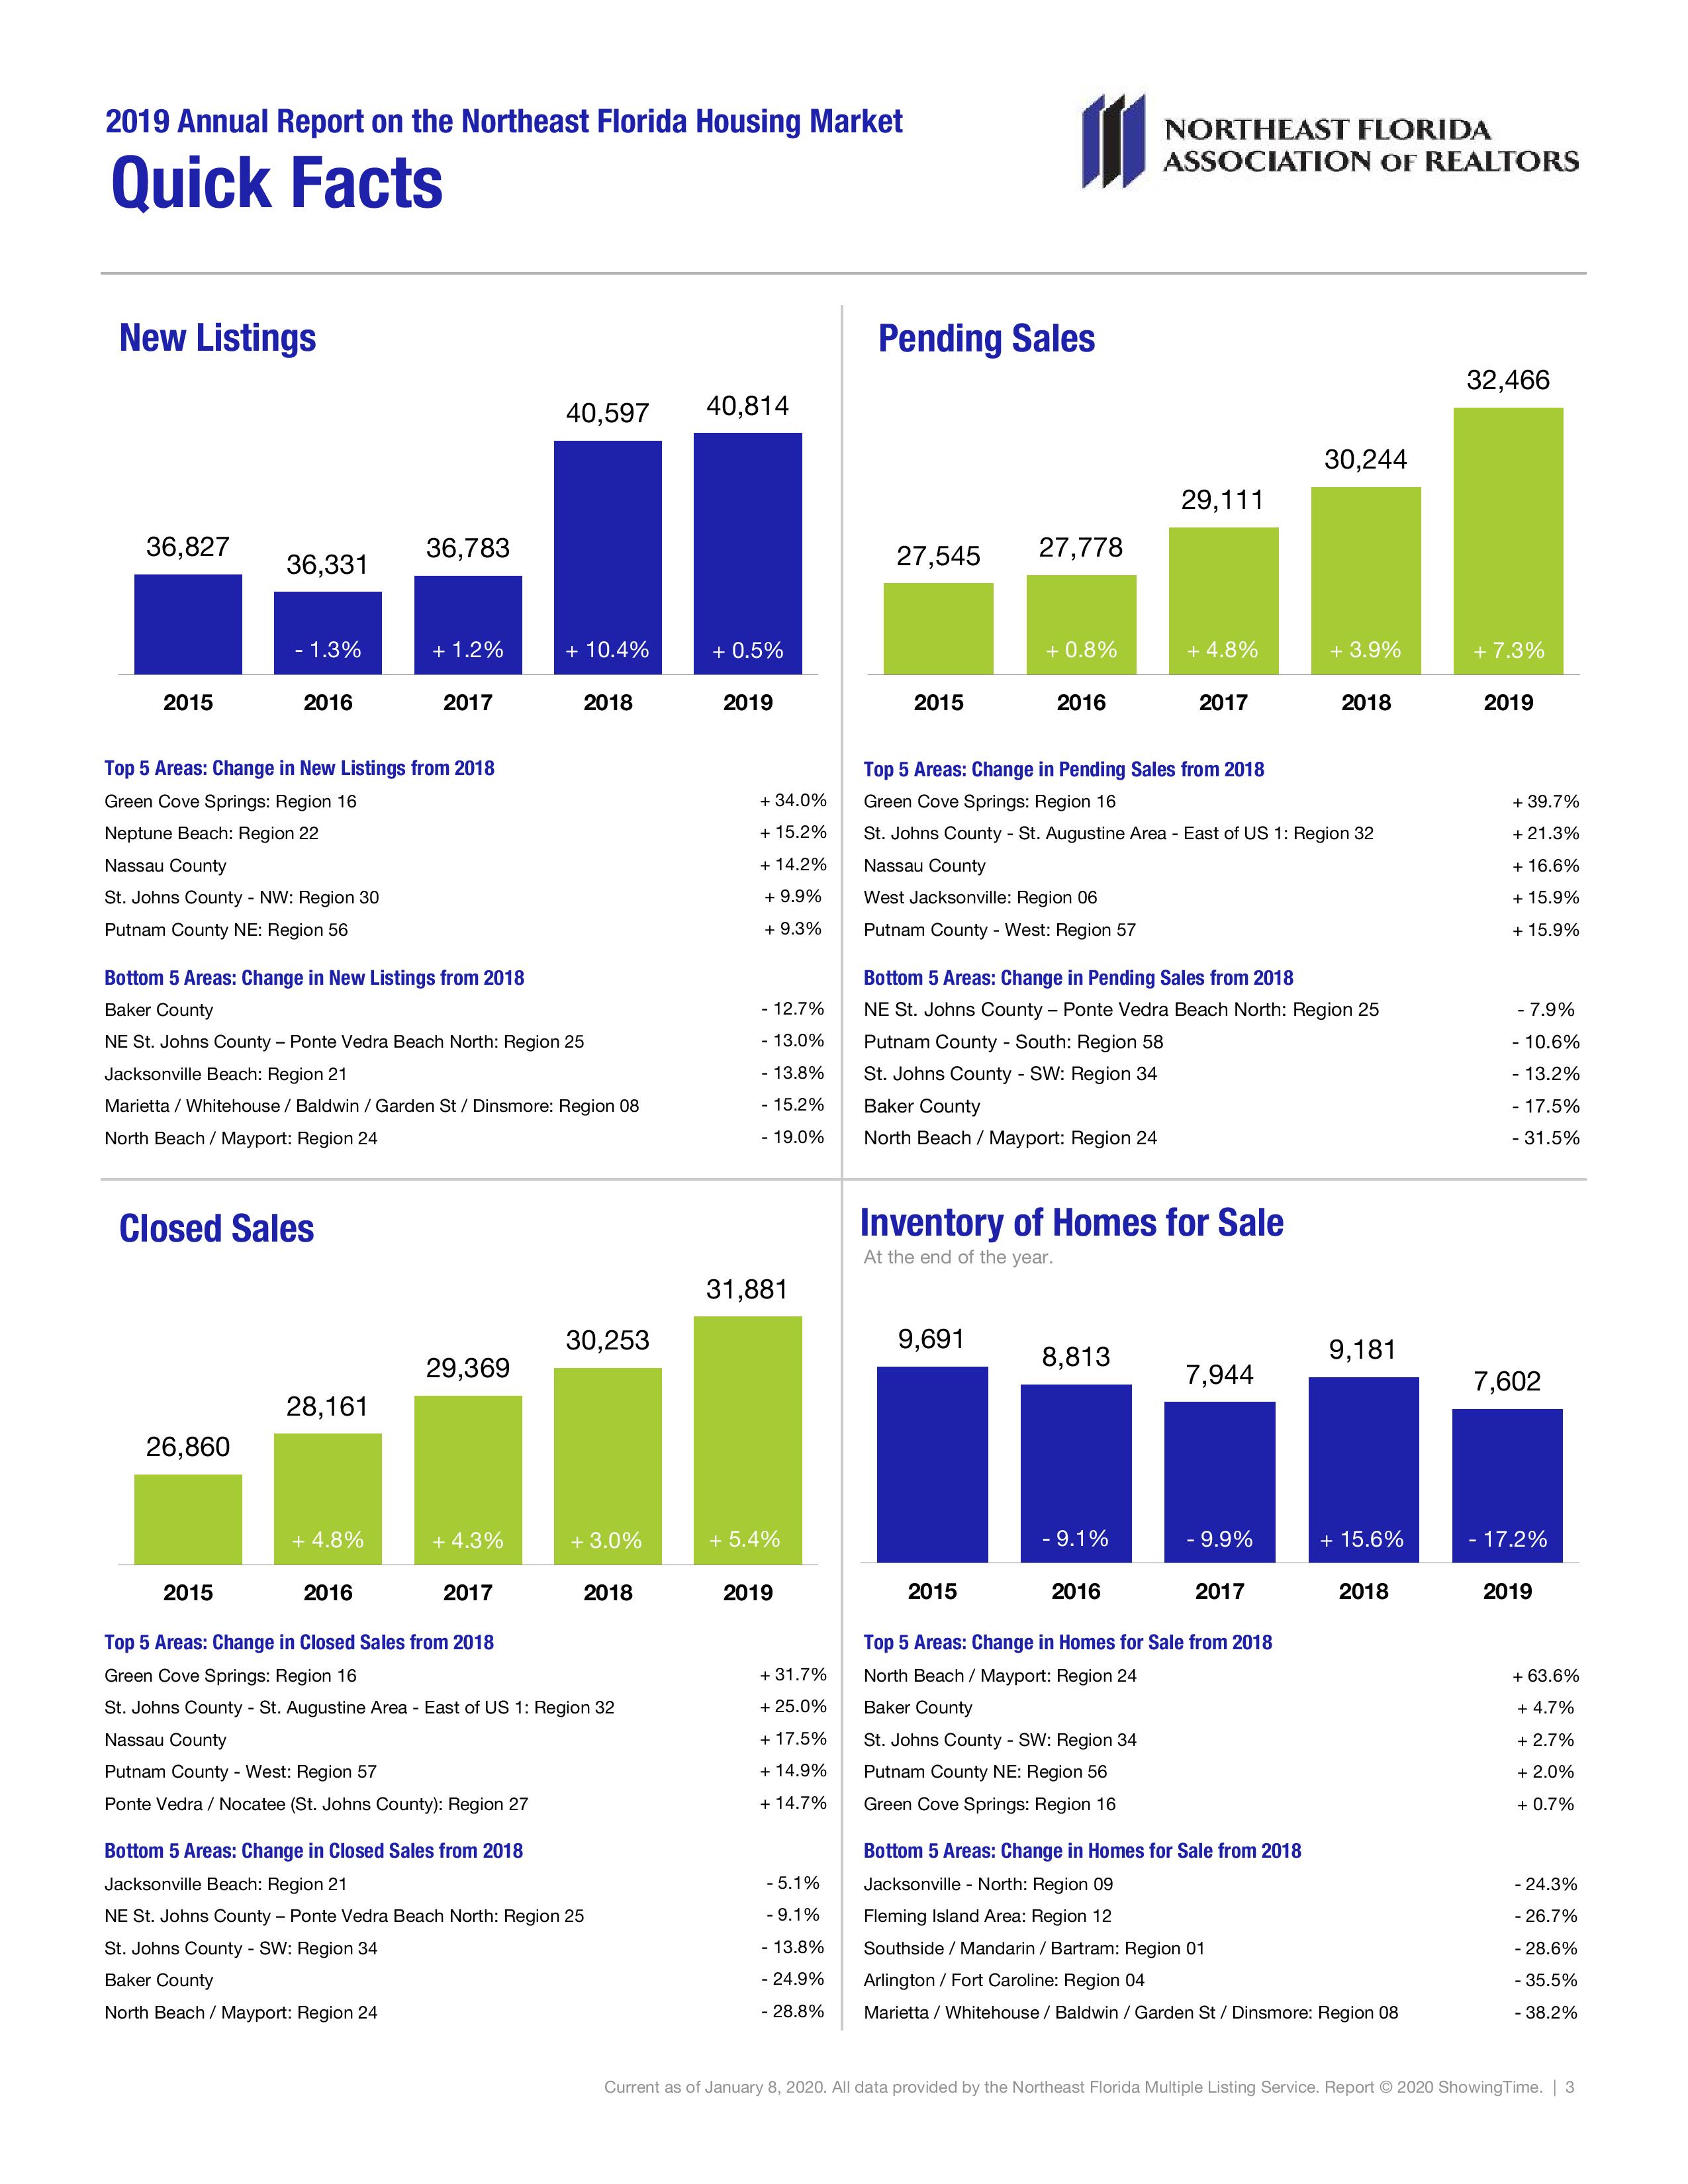
The 2019 housing market was fueled by the overall strength of the economy across most of the country. The stock markets reached new highs throughout the year, improving the asset bases of millions of Americans. Unemployment rates fell to 50-year lows, while wages increased, creating new home buyers. Mortgage rates also declined significantly from 2018, helping to offset affordability stresses caused by continued price appreciation nationally.
With a strong economy and low mortgage rates, buyer activity has been strong. However, most markets are being constrained by inventory levels that are still below historical norms. With supply and demand continuing to favor sellers, prices continue to rise.
With 10 years having now passed since the Great Recession, the U.S. has been on the longest period of continued economic expansion on record. The housing market has been along for much of the ride and continues to benefit greatly from the overall health of the economy. However, hot economies eventually cool and with that, hot housing markets move more towards balance.
Sales:
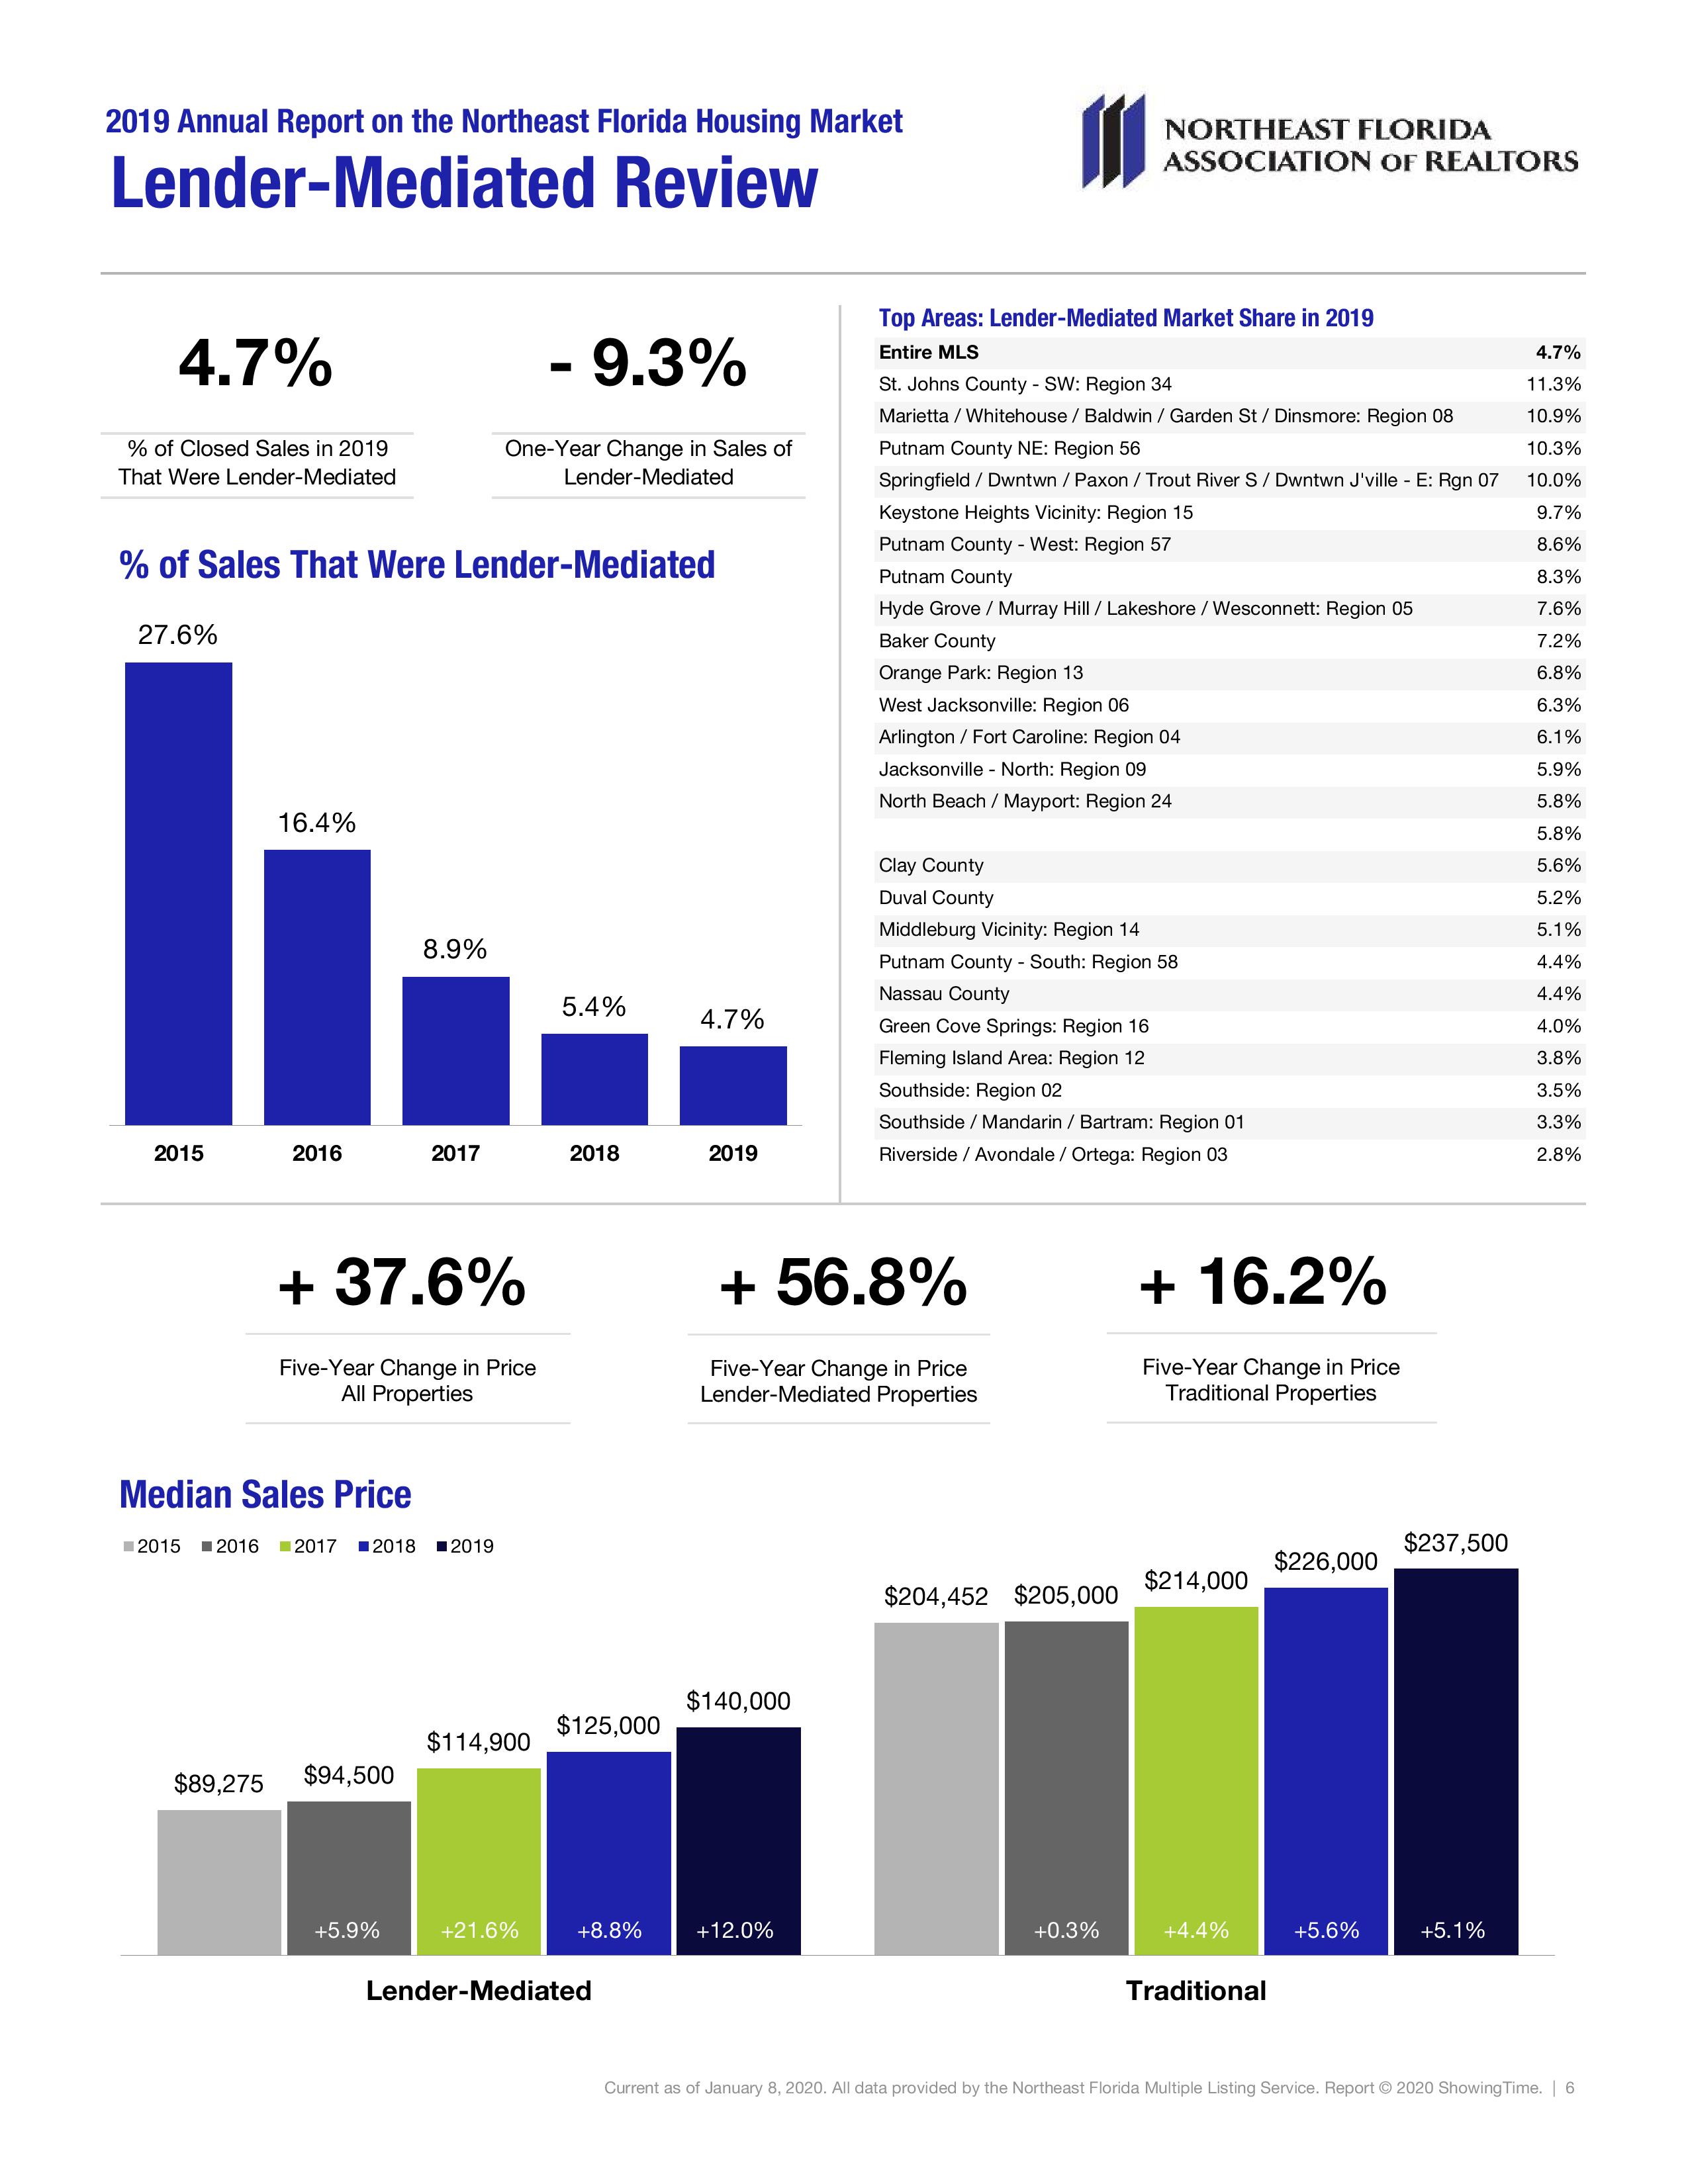
Pending sales increased 7.3 percent, finishing 2019 at 32,466. Closed sales were up 5.4 percent to end the year at 31,881.
Listings:
Comparing 2019 to the prior year, the number of homes available for sale was lower by 17.2 percent. There were 7,602 active listings at the end of 2019. New listings increased by 0.5 percent to finish the year at 40,814.
Lender-Mediated Properties:
The foreclosure market continues to be a hint of its former unhealthy peaks. In 2019, the percentage of closed sales that were either foreclosure or short sale decreased by 9.3 percent to end the year at 4.7 percent of the market.
|
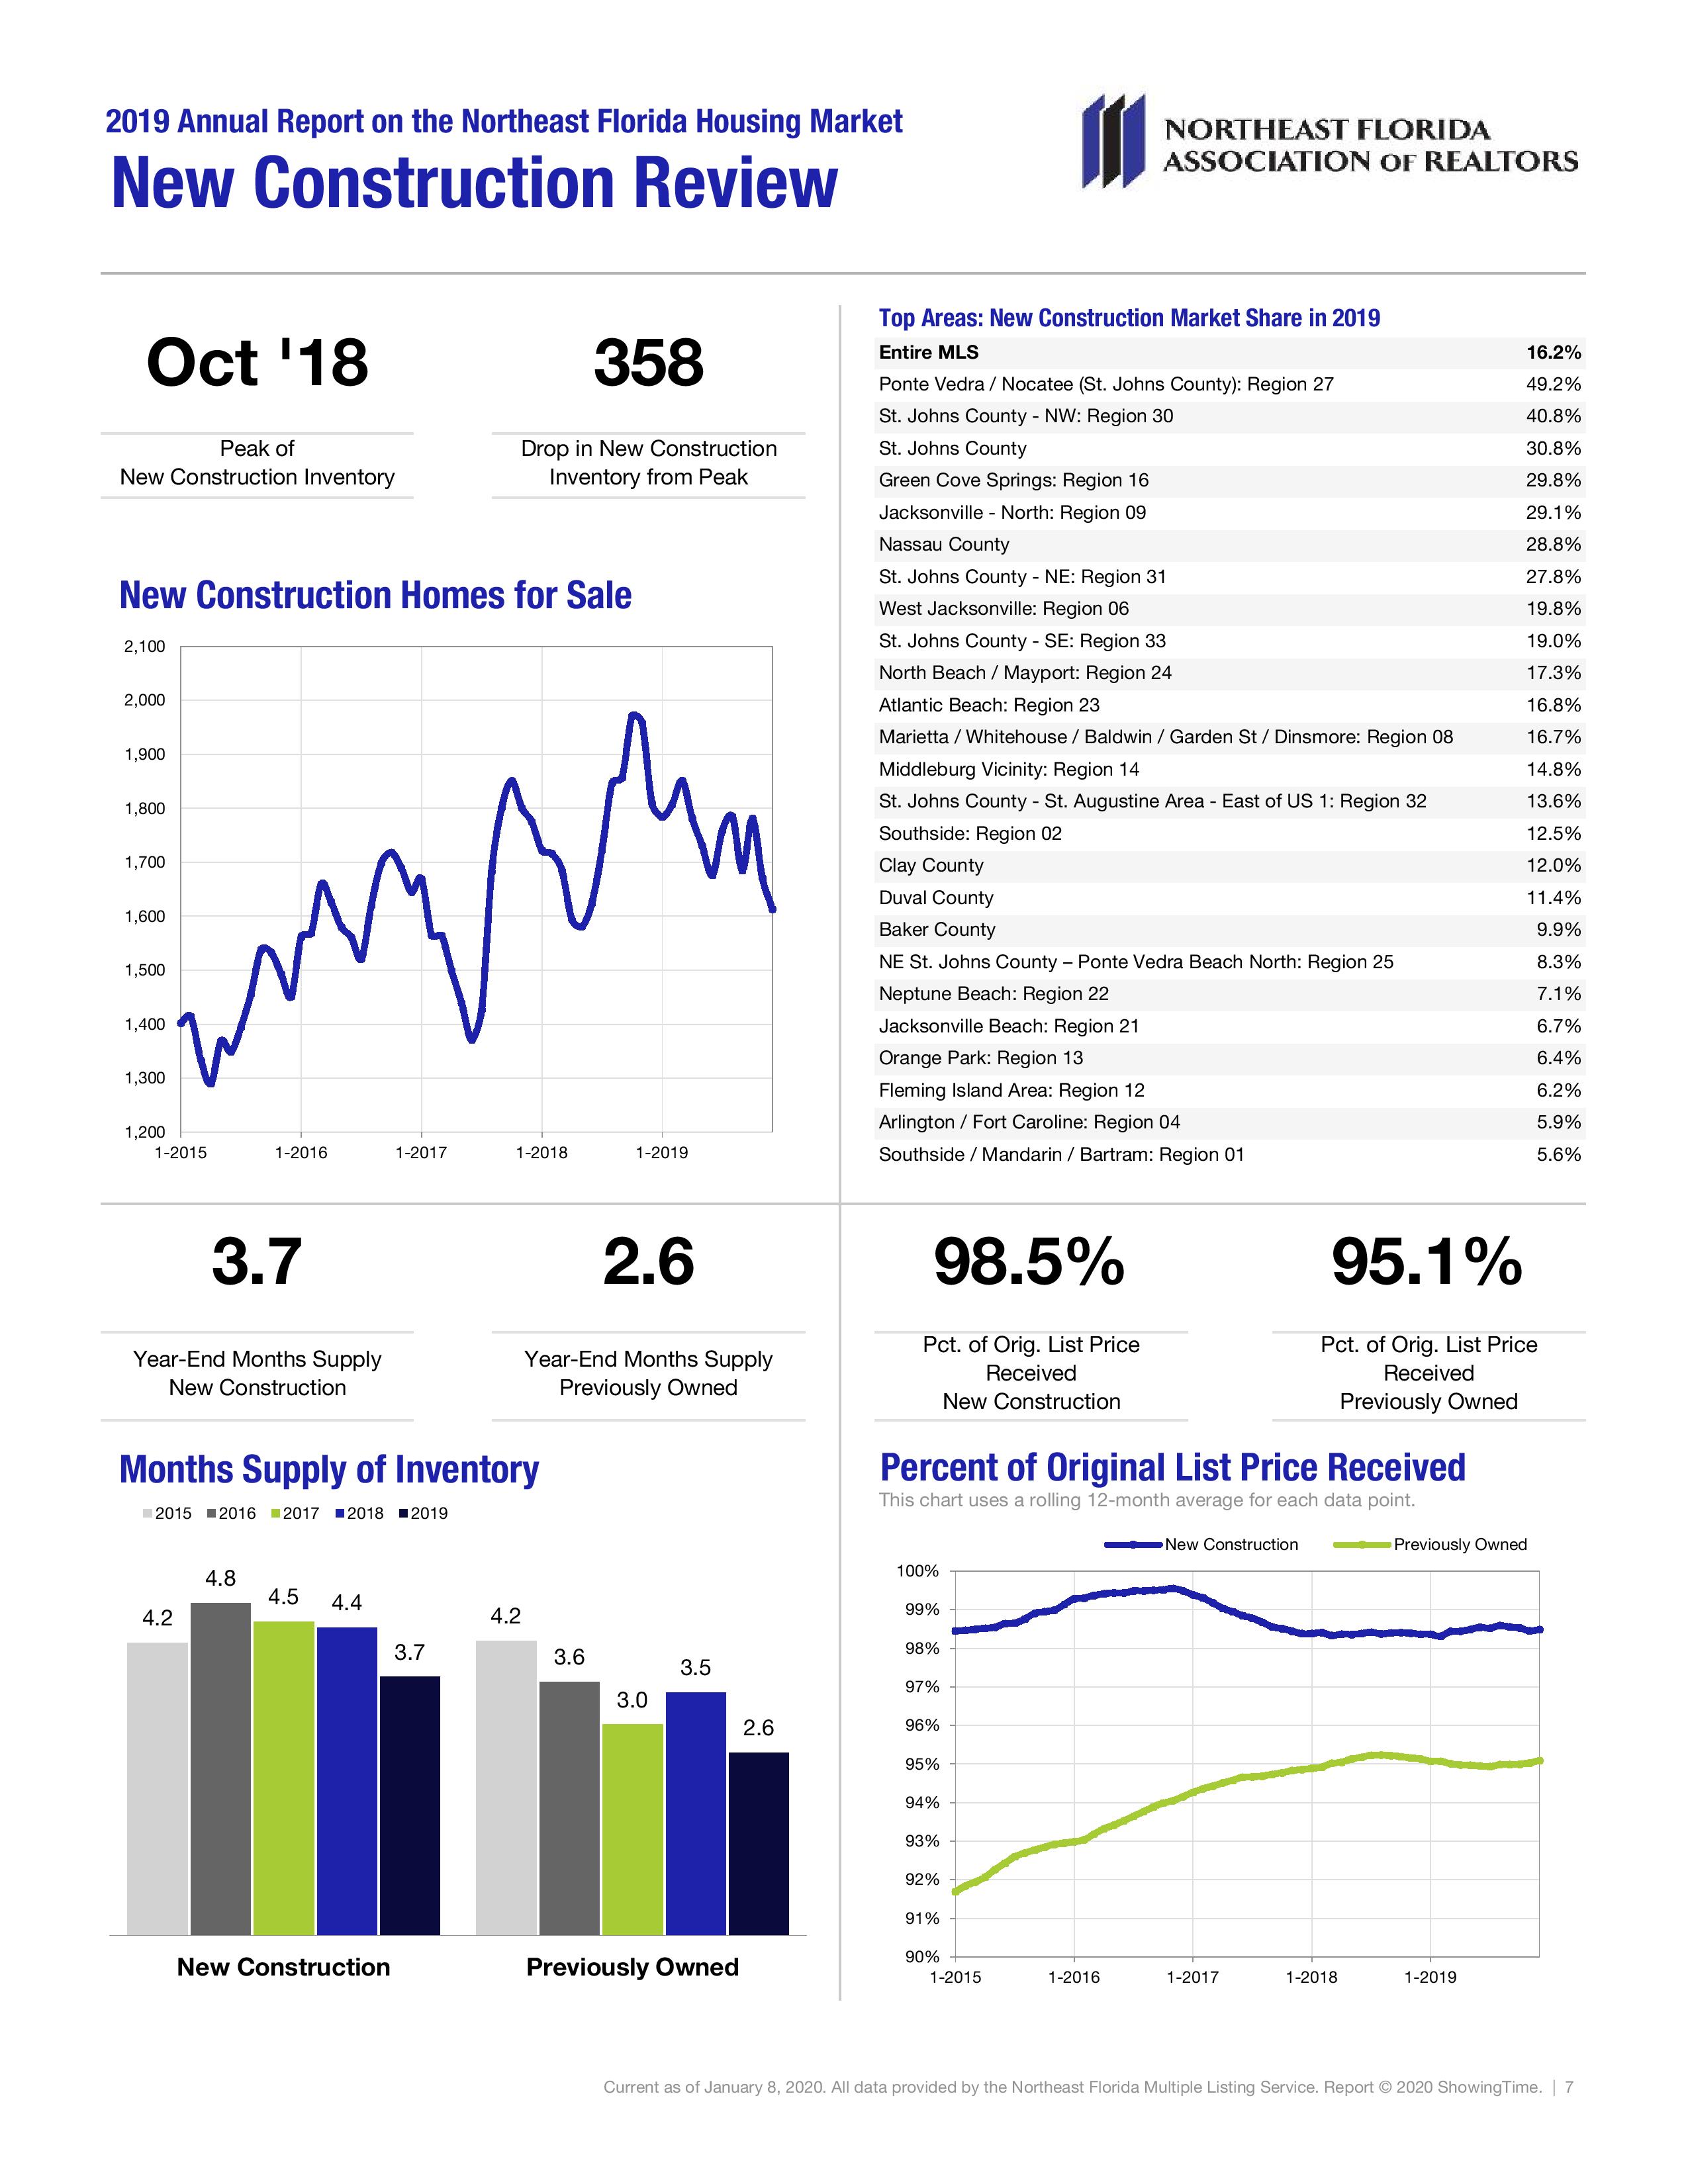
New Construction: : Nationally, builder activity grew in 2019 versus levels seen in 2018, though the total units being built remains lower than needed for long-term supply. Locally, new construction market share was at 16.2 percent, while months of supply finished 2019 at 3.7 months. Previously owned homes have seen months of supply decrease from 4.2 to 2.6 months over the last five years, and new construction supply has dropped from 4.2 to 3.7 months.
Prices:
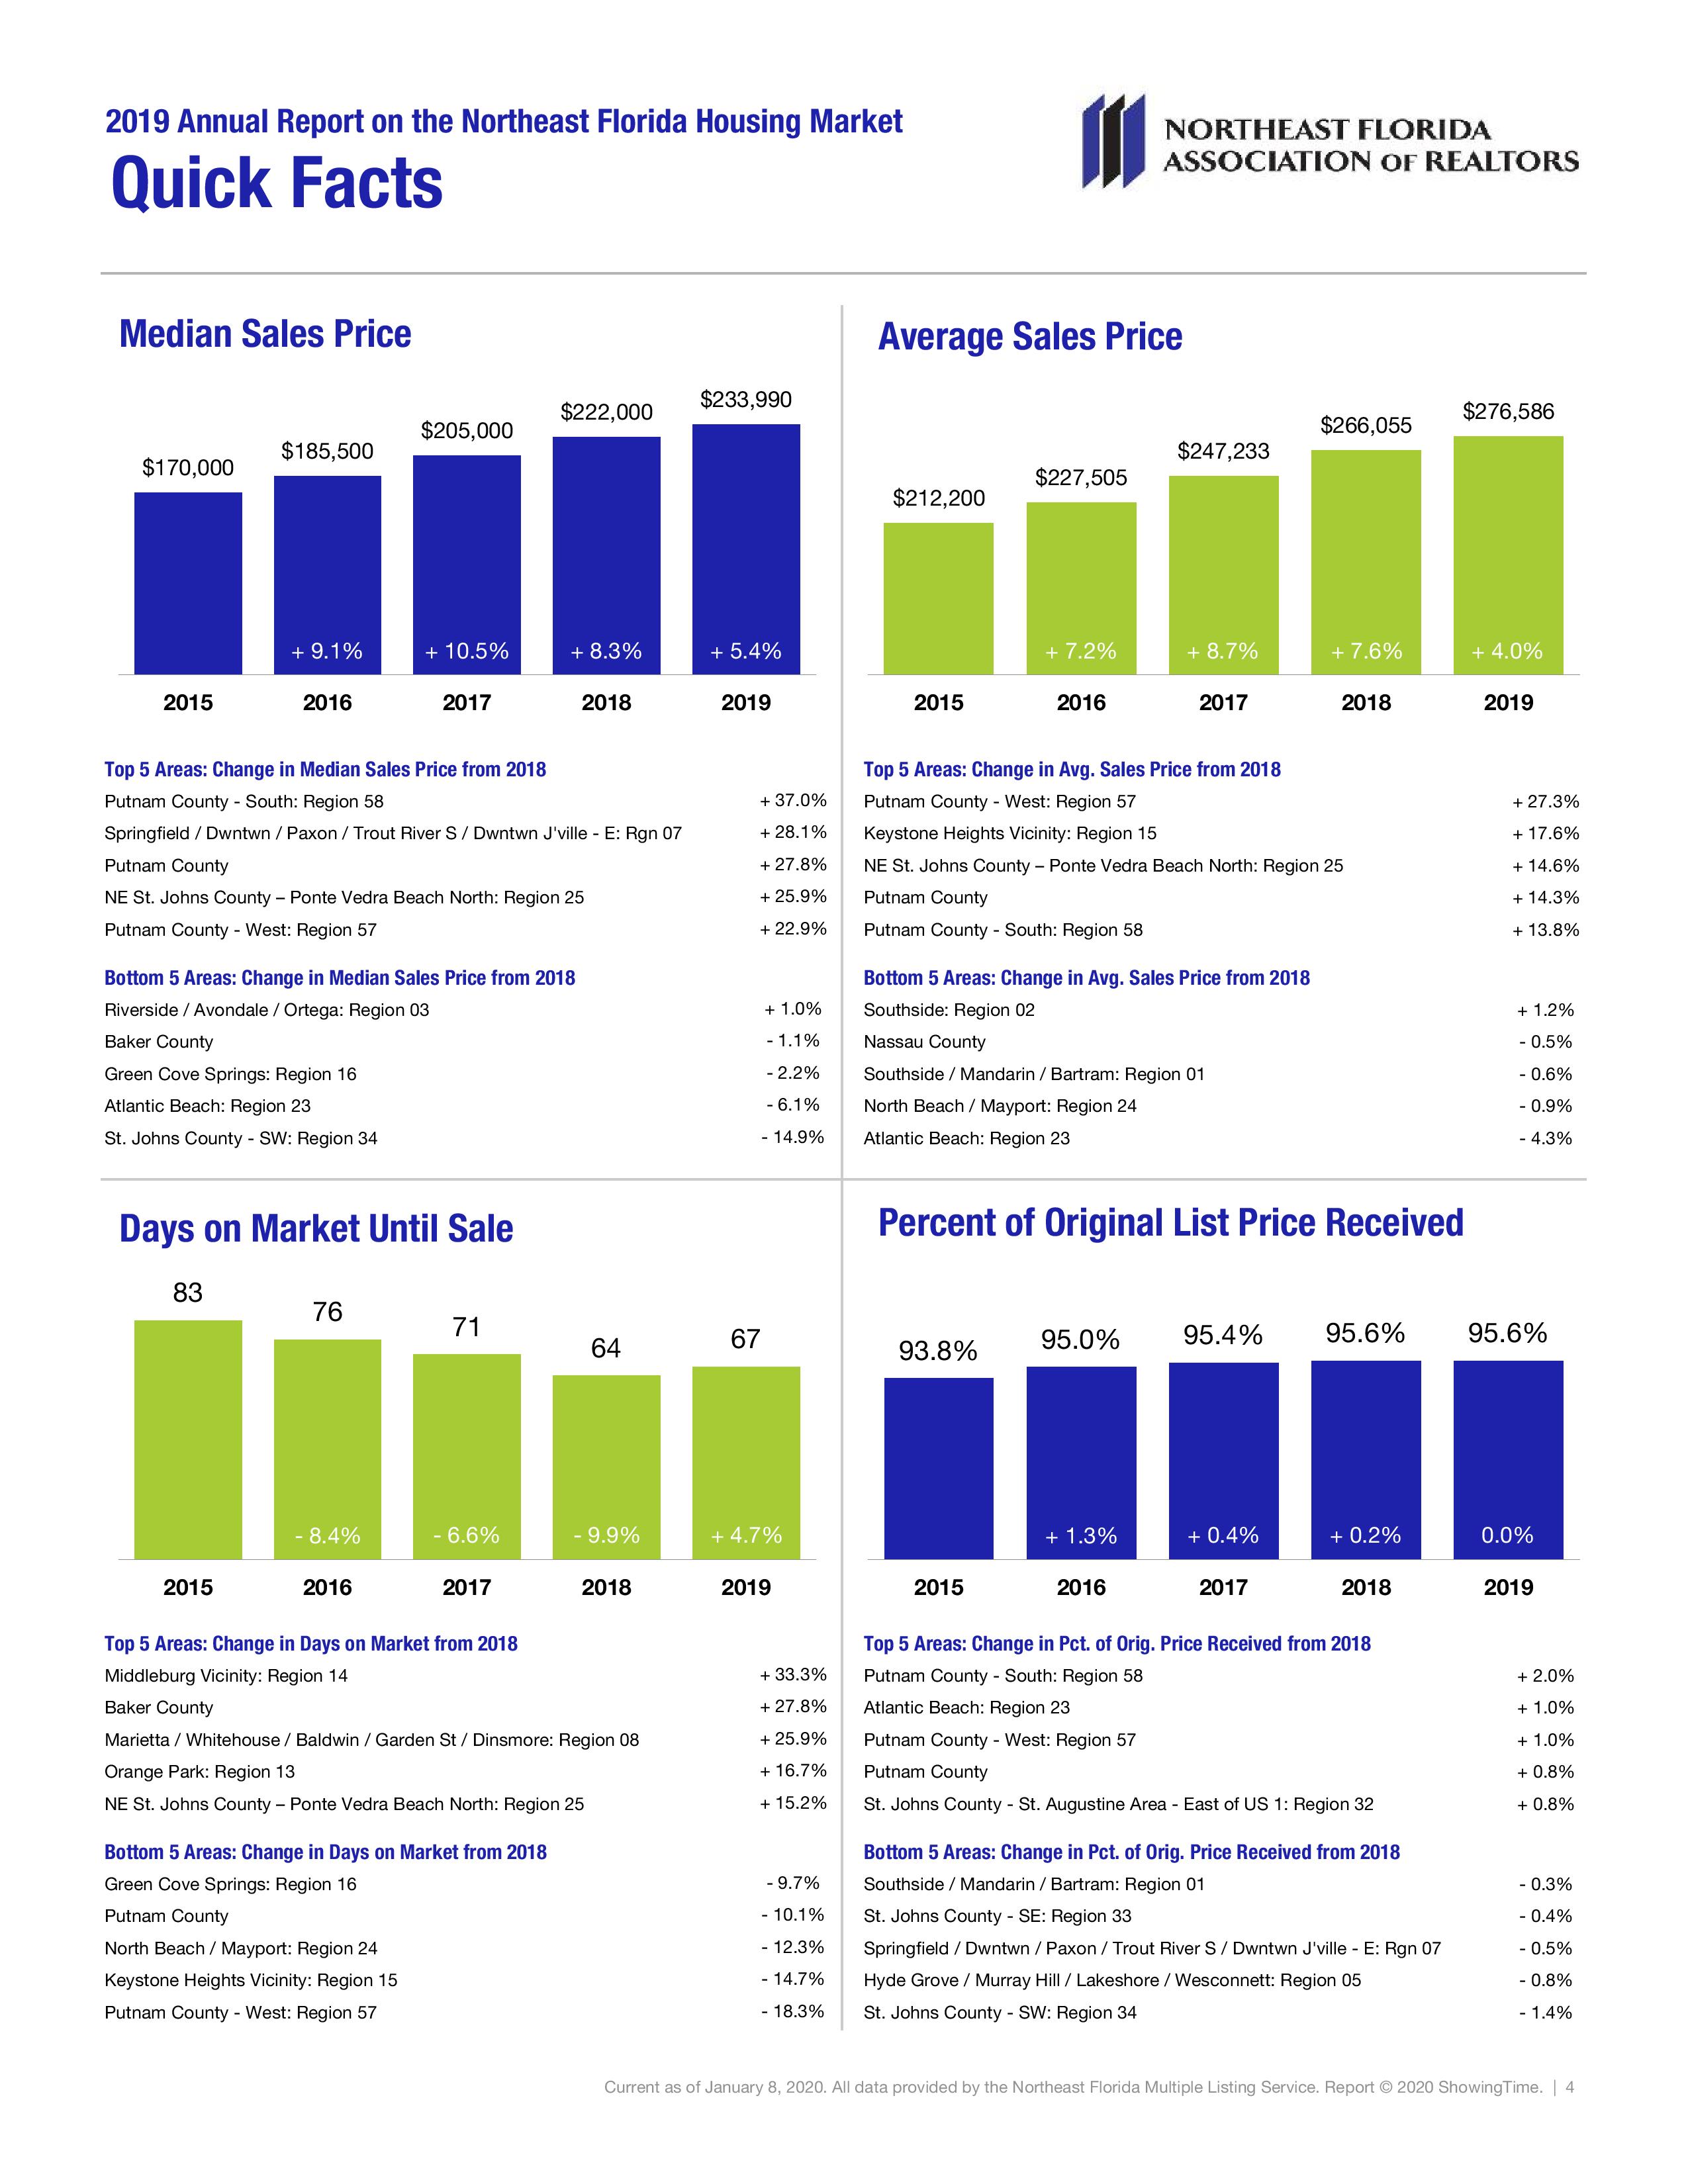
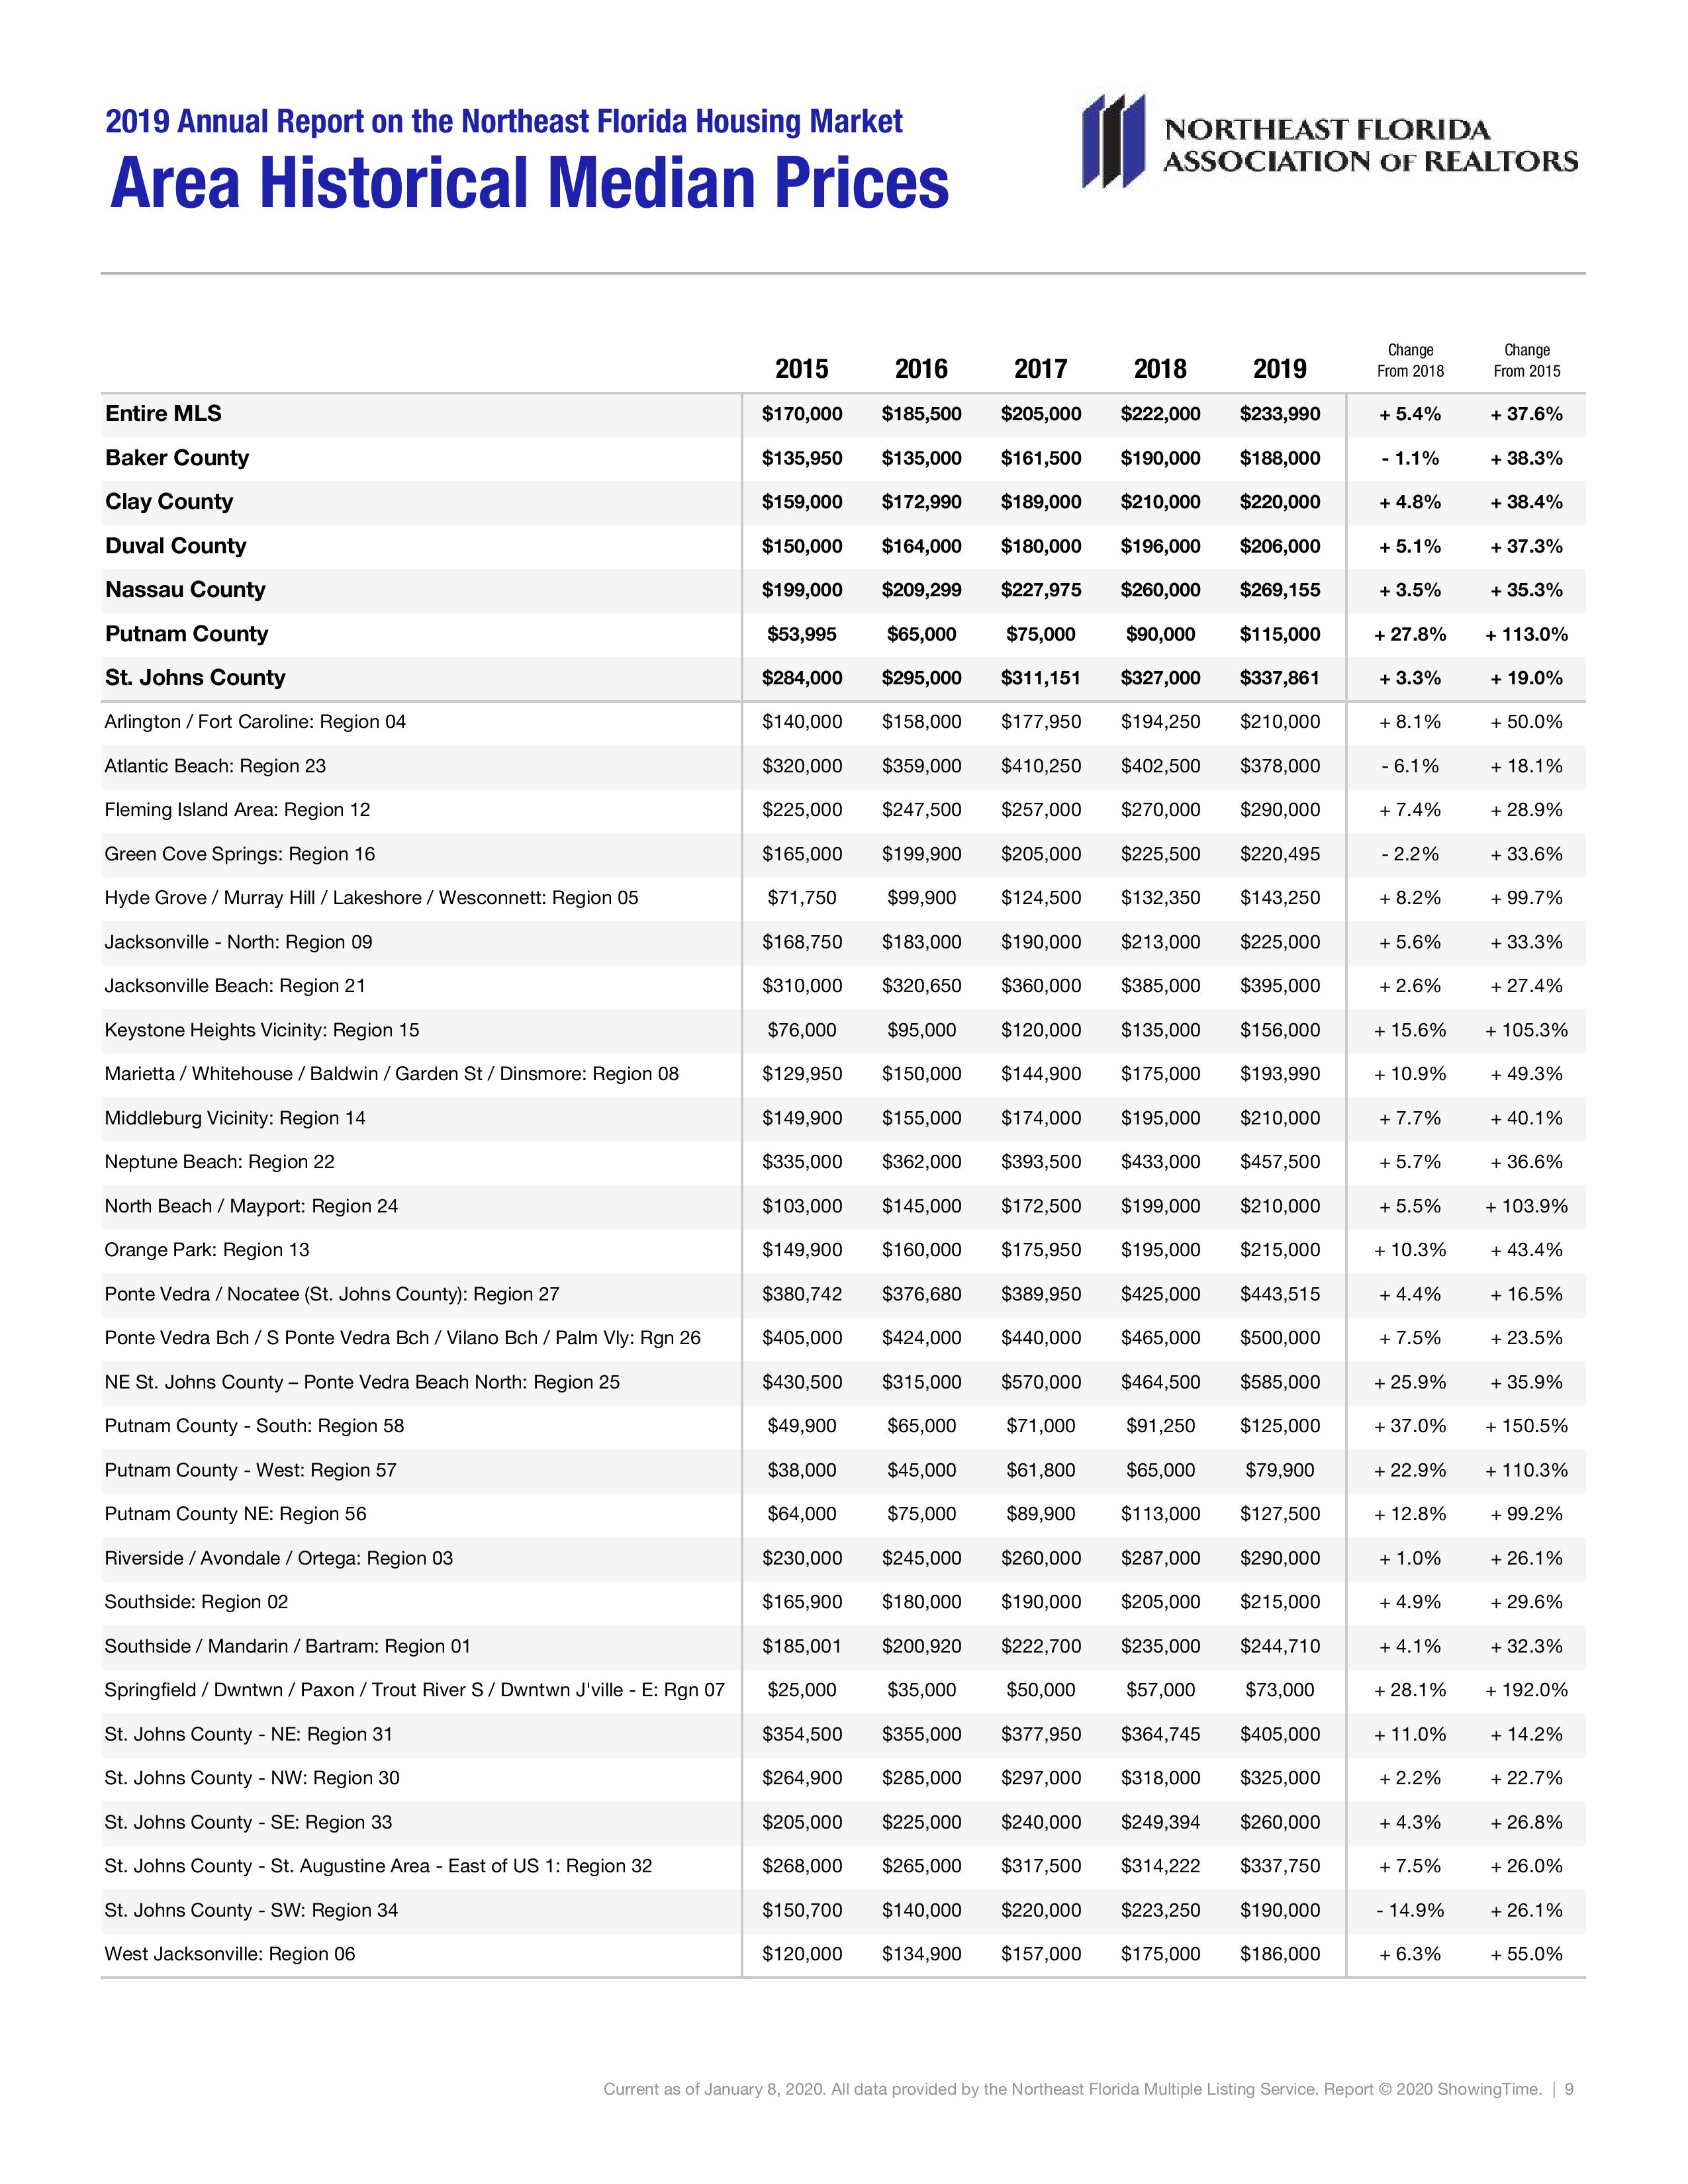
Home prices were up compared to last year. The overall median sales price increased 5.4 percent to $233,990 for the year. Single Family home prices were up 3.4 percent compared to last year, and Townhouse-Condo home prices were up 5.3 percent.
While the Federal Reserve moved to temper the hot economy with four interest rate hikes in 2018, in 2019 they turned the heat back up, and reduced rates a total of three times during the year. The Fed’s rate decreases were due in part to GDP growth in 2019 that came in notably lower than 2018, showing the Fed’s alternating efforts to keep our economy at a steady simmer and not a full boil.
The housing market continues to remain healthy nationwide with price gains and limited inventory being the most common threads across markets. Tight inventory continues to constrain buyer activity in part of the country, while some areas are seeing increased seller inventory starting to improve buyers’ choices. New construction activity continues to improve, but is still below levels required to fully supply the market’s needs.
As we look at 2020, we see continued low mortgage rates and a healthy economy giving a great start to housing in the new year. But in election years, we sometimes see a softening of activity that may temper the market in the second half of the year.
|